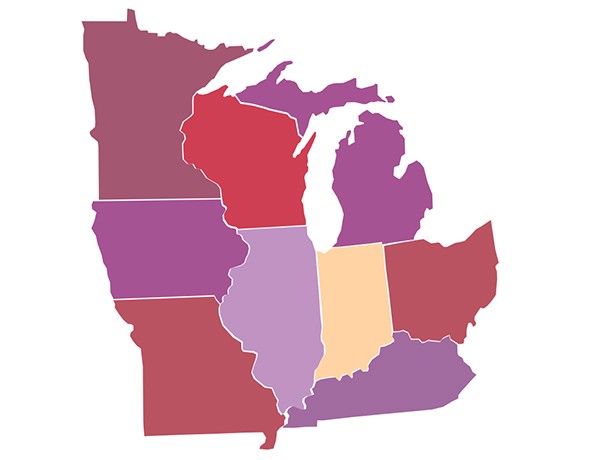
Building a FileMaker Heat Map
FileMaker Heat Map
Emory Brown of DB Services builds a FileMaker Heat Map using SVG Icons and conditional formatting:
Creating A Heat Map
FileMaker not only has the ability to import SVG icons, it also gives the ability to change their color with conditional formatting. This is key to using them for data visualization. All we need to get a heat map up and running are our SVG icons and some conditional formatting rules. For my map, I am using individual American states created in Adobe Illustrator. Once you have whichever SVGs you wish to use positioned on your layout, add conditional formatting based on data fields.
Visualize your data, learn how to construct a choropleth map, called a heat map in FileMaker. Includes a video and sample demo file.
Outside the box thinking, and some great key concepts here:
- Use SVG Icons to build a map
- Use conditional formatting to change icon colors on the fly
- Using hover states to highlight by adding a second layer
- Allowing drill down and/or popovers for more information
Want to use SVG’s in other ways? Brown has the answer:
Custom Charting Beyond Heat Maps
SVGs are a very flexible medium, and can be used for more than just a heat map. With this same technique, you can make pretty much any custom chart you can imagine. One could highlight parts of a car or other object, display health data on a human body, or illustrate an organization chart. the sky is the limit!
Best of all, Brown explains all in a video and provides a downloadable example file.
Source: FileMaker Heat Maps | DB Services

